Understanding Steel Roofing and Siding Load Tables
Posted by McElroy Metal ● Aug 15, 2024 8:00 AM
Understanding Load Tables can feel complicated, especially if you’re not an engineer, but knowing the basics can help you make informed decisions about your building projects. Here, we’ll break down the key elements of load tables and clarify some common misconceptions.
The Basics of Load Tables
Load tables are essential tools in the construction industry. They detail the capacities of various materials under different conditions. In this example (https://info.mcelroymetal.com/hubfs/assets/max-rib%2029%20ga%2080%20ksi%20g100%20painted.pdf) you will find the product description and a simple product drawing. The first section includes critical details such as gauge, yield strength, and weight.
1. Gauge: Load tables vary by gauge, width, and product profile.
2. Yield Strength: Some products offer multiple yield strengths, like 50 ksi or 80 ksi.
3. Weight: The product weight is essential for those concerned about the overall roof assembly weight.
Interpreting Load Tables
Understanding how to read the main section of a load table is crucial. For example, if you’re looking at a 5-foot span in the positive direction with a 2-span scenario, you’ll find the capacity listed under that category. It’s important to note that load tables display values in pounds per square foot (psf), not wind speeds.
Common Misconception: People often misinterpret these tables as wind speed charts. However, load tables only show the load capacity in pounds per square foot, not the wind speed a product can withstand.
Positive vs. Negative Loads
Positive and negative load tables define a roofing system’s load capacities. Positive tables detail vertical loads (e.g., snow, wind, dead loads), while negative tables specify uplift forces (e.g., wind uplift).
When using McElroy Metal’s load tables, negative load capacities are listed in the load table for through-fastened and standing seam products at the bottom of the table. It’s crucial to pay attention to the footnotes in the tables, which provide context on different clip types and other specific conditions.
Understanding Deflection
While a panel might hold more weight before breaking, building codes limit how much it can bend. This prevents issues such as ponding water on roofs, which can lead to further structural problems, including roof collapse in extreme cases. Different areas have different deflection limits, like L/180 or L/240, dictating how much a panel can bend.
· L/180: This is a deflection limit used in structural engineering to ensure that a beam or structural member does not bend excessively under load. The maximum allowable deflection is calculated by dividing the span length (L) by 180. For example, if the span length is 180 inches, the maximum deflection allowed would be 1 inch (180/180). This limit is typically used in situations where some visible deflection is acceptable, but it must still be controlled to avoid structural or aesthetic issues.
· L/240: This is a stricter deflection limit than L/180 and is used in structural engineering to minimize bending under load even further. The maximum allowable deflection is calculated by dividing the span length (L) by 240. For instance, if the span length is 240 inches, the maximum deflection allowed would be 1 inch (240/240). This limit is often used in applications where greater precision and minimal deflection are crucial, such as in certain architectural finishes or sensitive structural elements.
Deflection Example: For a 5-foot span (60 inches), L/180 allows a maximum deflection of one-third of an inch, while L/240 allows a maximum deflection of one-quarter of an inch.
Span Conditions
The term span refers to the distance and number of building sections between each primary support. The span condition (single-span, two-span, three-span, etc.) significantly impacts the load capacities of the structural frame. See the images below to better visualize the difference between single and multiple-span conditions.
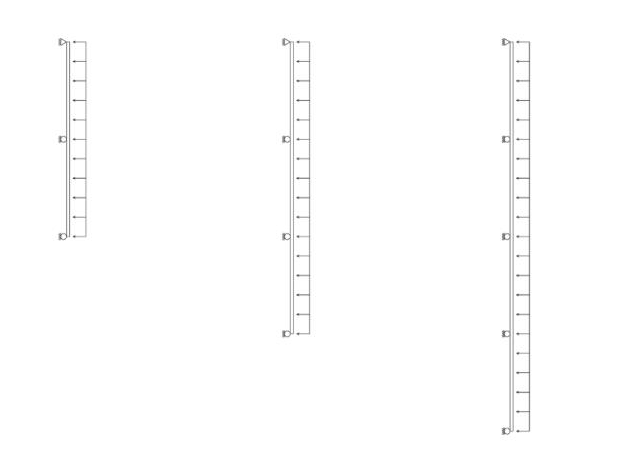
A two-span condition is typically one of the worst, but these span conditions vary, affecting the load capacity numbers differently.
Real-World Application
In practice, load tables assume uniformly distributed loads, which is often not true in real-world scenarios where loads vary. For example, consider the image below, which illustrates how snow can pile to greater depths at one location on a roof based on roof geometry and wind conditions.

Consequently, professionals use specific values to perform custom calculations to ensure the most accurate results.
Understanding load tables is complex, so it’s always recommended that you consult with a qualified professional for detailed engineering advice.
